

The PACER PERSPECTIVE
January 2017

Break from the herd.
Consider free cash flow.
- Michael Mack, Portfolio Manager
The Department of Labor’s new fiduciary regulations require many financial advisors to change the way they do business. While some advisors focus on the shift from commission to fee-based compensation, others are searching for ways to provide the value-add in their practice. Some of these trends include:
- Shifting from active to passive investments and from market cap to smart beta indexes.
- Pushing for lower costs
- Using tactical asset allocation to provide better risk-adjusted performance
- Offering more tax efficient solutions
- Looking for investment strategies to manage the volatility in the markets.
Inflows to Beta
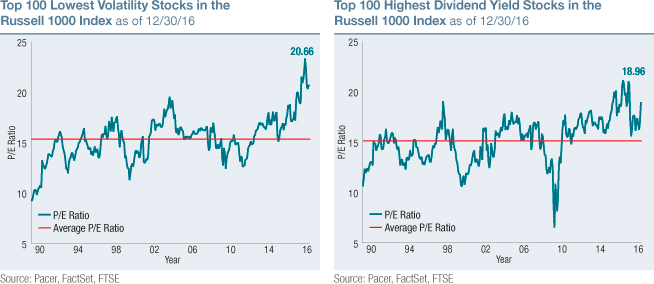
During the past couple of years, there have been significant flows into both low cost beta1 and rules-based smart beta2 indexing strategies. The shift to these types of indexing strategies will likely continue because of their ability to lower costs, remove behavioral biases, and potentially offer better risk-adjusted performance. The benefits of these investments make them appealing options, but as more people migrate towards these strategies, they become overcrowded. There are a few areas of the market that are starting to show signs of overheating, likely in part to recent investor flows. The low volatility and high dividend market segments stand out as two areas that may potentially become overpriced and crowded. Their valuations have moved toward the higher end of their historical range. Regardless of the cause, it’s important to be aware of the high valuations and plan accordingly.
(1)Low cost beta ETFs offer exposure to a major index such as the S&P 500® usually for a low fee.
(2)Smart Beta ETFs develop transparent rules to construct an index based on factors such as size, value and volatility instead of a cap-weighted index strategy.
Price-to-earnings ratio (P/E ratio) is a fundamental measure commonly used to determine if an investment is valued appropriately. Each holding’s P/E is the latest closing price divided by the latest fiscal year’s earnings per share. Negative P/E ratios are excluded from this calculation.
It’s good to be different
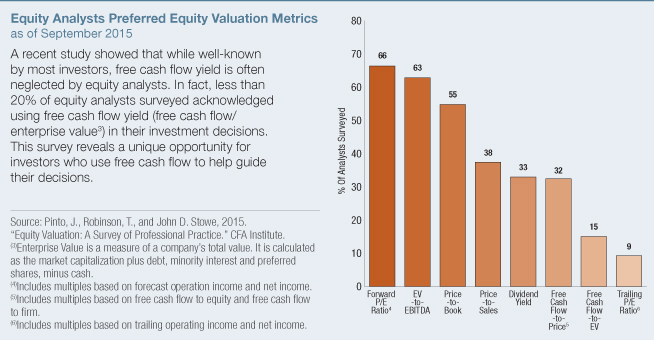
As large flows continue to pile into market cap, low volatility, high dividend and traditional value strategies, there may be a better opportunity by using a different approach. It may be wise to consider free cash flow yield (FCFY) when selecting investment candidates. Free cash flow is the foundation of a company’s value. It serves as a source of funds, a measure of profitability and most importantly value. Free cash flow yield* shows the cash available relative to the company’s enterprise value. The ultimate goal of any enterprise is to produce free cash flow. Making investment decisions based of the potential free cash flow generation of the company should provide investors with a more informed decision.
 ...And it could pay off
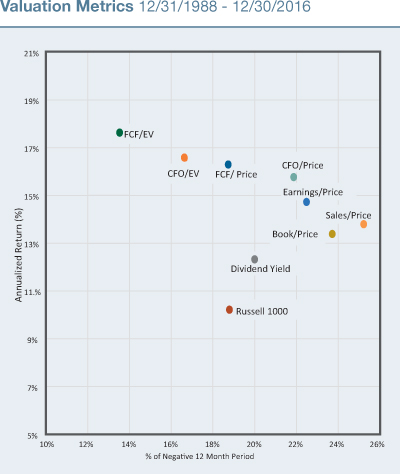
Over the past 28 years, selecting companies based on free cash flow yield has offered the highest return out of all valuation metrics studied. Its effectiveness in identifying value opportunities did better than the metrics most used by equity analysts. As shown in the chart to the right, free cash flow yield (FCF/EV) not only provided the highest annualized returns, but also has the fewest numbers of periods with negative 12 month returns.
*This is an internal statistic and does not constitute investor yield.
Chart Key:
FCF/EV: Free Cash Flow/Enterprise Value
CFO/EV: Cash From Operations/Enterprise Value
FCF/Price: Free Cash Flow/Price
CFO/Price: Cash From Operations/Price
Book/Price: Book Value/Price
Data calculated based on the top 100 companies in the Russell 1000 Index for each valuation metric.
PAST PERFORMANCE IS NOT INDICATIVE OF FUTURE RESULTS.
“In 2017, later-stage valuation factors such as Price to Earnings, Cash Flow, or Free Cash Flow, which generally lead following beta rallies, could work best.”
– Merrill Lynch
 Why now?
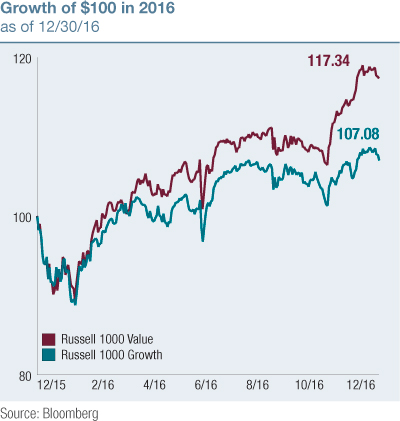
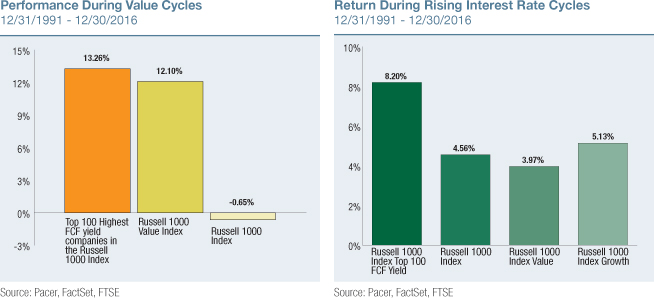
1. In 2016, investors saw a shift in performance from growth to value. Outperformance in the value segment began as investors shifted their allocations from the defensive and growth segments of the market towards cyclical and value segments in anticipation of higher economic growth.
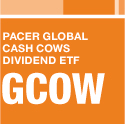
2. The Fed tightening and rising interest rates.
After remaining at record lows for several years, interest rates rose slightly at the end of 2016 and are expected to continue to rise gradually. During periods where interest rates are rising, the top 100 highest free cash flow yielding companies in the Russell 1000 have historically performed better than its counterparts. Companies with high FCFYs may hold up well during these periods because of their strong balance sheets and lower financing needs.
Research from Bernstein found that FCF yield also worked better than other income factors during the Fed tightening cycles. We found that during rising interest rates cycles, companies with high FCF yield outperformed the Russell 1000. Traditionally, free cash flow yield as an indicator has worked well during value cycles. If the value leadership continues, free cash flow yield may continue to perform well.
How to Invest in High Free Cash Flow Yield
Pacer ETFs’ Cash Cows Series offers two ETFs that screen companies based on free cash flow yield in a global and US index.
 Pacer Global Cash Cows Dividend ETF
Uses a free cash flow yield screen and a dividend yield screen to invest in 100 companies from the FTSE Developed Large-Cap Index. It aims to provide a continuous stream of income and capital appreciation over time by screening for companies with a high free cash flow yield and a high dividend yield.
 Pacer US Cash Cows 100 ETF
Is a strategy driven exchange traded fund that aims to provide capital appreciation over time by screening the Russell 1000 for the top 100 companies based on free cash flow yield.
PAST PERFORMANCE IS NOT INDICATIVE OF FUTURE RESULTS.
This document is not intended to be relied upon as a forecast, research or investment advice, and is not a recommendation, offer or solicitation to buy or sell any securities or to adopt any investment strategy. This document represents an assessment of the market environment at a specific time and is not intended to be a forecast of future events or a guarantee of future results. The user of this information assumes the entire risk of any use made of the information provided herein.
Russell 1000 Value Index measures the performance of those Russell 1000 companies with lower price-to-book ratios and lower forecasted growth values. The index was developed with a base value of 200 as of August 31, 1992.
Russell 1000 Growth Index measures the performance of those Russell 1000 companies with higher price-to-book ratios and higher forecasted growth values. The index was developed with a base value of 200 as of August 31, 1992.
Russell 1000 Index is a market-capitalization weighted index representing the top 1000 large-cap stocks in the Russell 3000 Index.
S&P 500® Index measures the performance of the large capitalization sector of the U.S. equity market and is considered one of the best representations of the domestic economy. Utilizing a market-cap weighting structure, this index invests in the 500 largest U.S. firms.
The Bloomberg Barclays US Aggregate Bond Index is a broad-based flagship benchmark that measures the investment grade, US dollar-denominated, fixed-rate taxable bond market.