

The PACER PERSPECTIVE
August 2016

Finding Quality Investments
in an Overcrowded Market
- Michael Mack, Portfolio Manager
Given the recent market volatility, investors are searching for stability in their portfolios. Weak economic growth, a hawkish Fed and declining earnings are creating more urgency for this stability. The Fed’s concern in raising interest rates to normal levels is slowly trickling through the economy. Earnings have been declining since they peaked at the end of 2014. The strong dollar and low commodity prices are hurting corporate earnings and are partly to blame for this decline.
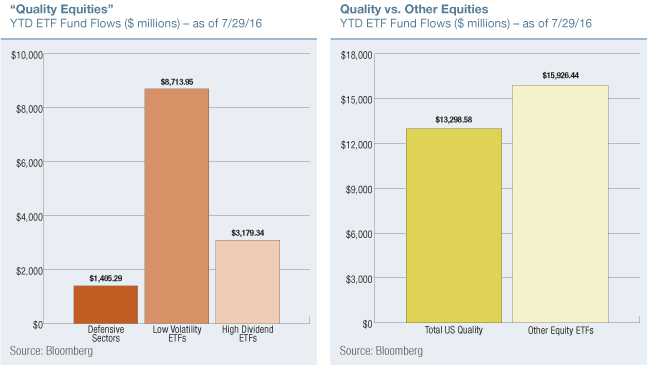
Significant Inflows Into 3 Quality Areas
Year to date, the top 3 low volatility ETFs have attracted nearly $9 billion in assets. The top 3 dividend ETFs have seen $3.1 billion in inflows and defensive sectors of Utilities and Consumer Staples accrued inflows of $1.4 billion. These three categories of quality equities received inflows of more than $13 billion this year, only $3 billion less than all other equity ETFs combined.
As many investors seek “shelter” in these quality equities, the trade is becoming alarmingly overcrowded. A recent survey conducted by Merrill Lynch found that investors believe US High Quality Stocks have become the most popular trade for investors. When interest in these equities grows too high, they begin trading at a premium and could be more expensive to buy than what they are worth. So, are these quality areas truly congested? One way to answer this is to look at the valuations of these areas of the market.
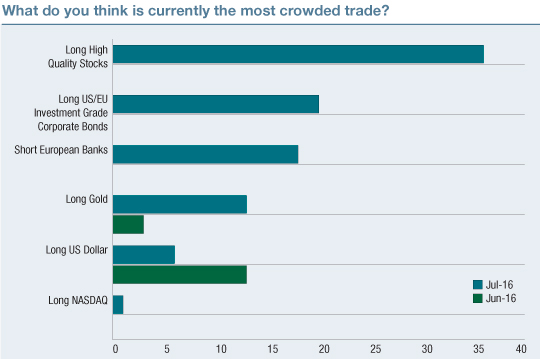
Source: BofA Merrill Lynch Global Fund Manager Study Reprinted by permission. Copyright © 2016 Merrill Lynch, Pierce, Fenner & Smith Incorporated (“Bank of America Merrill Lynch”). The use of the above in no way implies that Bank of America Merrill Lynch or any of its affiliates endorses the views or interpretation or the use of such information or acts as any endorsement of Pacer Advisors’ use of such information. The information is provided “as is” and Bank of America Merrill Lynch and its affiliates does not warrant the timeliness, accuracy or completeness of the information.
Low Volatility Stocks Are Trading at a Premium
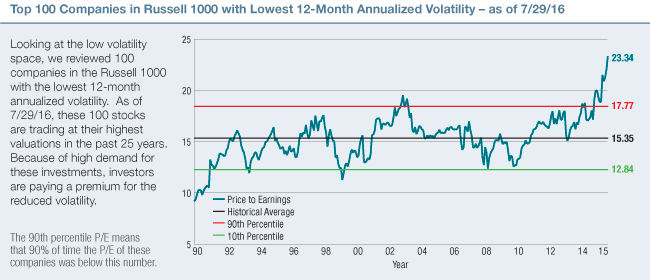
We chose to evaluate 100 companies because it was a solid sample size and could be used to remain consistent throughout the assessment in this piece.
Russell 1000 is an index of approximately 1,000 of the largest companies in the U.S. equity markets. The Russell 1000 comprises over 90% of the total market capitalization of all listed U.S. stocks.
Price-to-earnings ratio (P/E ratio) is a fundamental measure commonly used to determine if an investment is valued appropriately. Each holding’s P/E is the latest closing price divided by the latest fiscal year’s earnings per share. Negative P/E ratios are excluded from this calculation.
Annualized Volatility is based on monthly returns from the most recent date indicated on the page and expressed as a standard deviation percentage. Standard deviation is a measure of volatility and illustrates the extent of variation (whether higher or lower) that exists from the average given set of results. A low standard deviation indicates that the results tend to be very close to the average result (a low degree of volatility). In contrast, a high standard deviation indicates that the results are spread out over a large range of outcomes (a high degree of volatility).
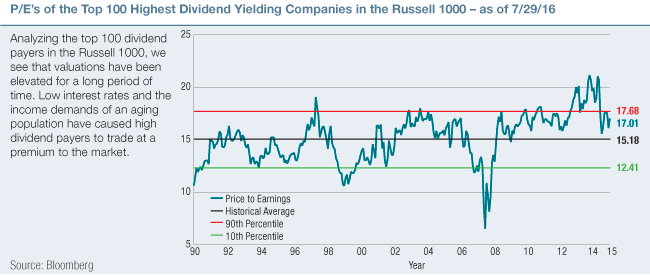
Dividend Paying Stocks Are Trading at a Premium
Defensive Sectors Are Trading at a Premium
Finally, comparing the defensive sectors of Consumer Staples and Utilities to the rest of the market, we find that with the exception of Energy, where earnings are depressed from low oil prices, the defensive sectors are at a premium relative to their history while other sectors are trading at a discount. If economic conditions continue to worsen, paying a higher premium for stability could very well be justified. However, if conditions stabilize, then the high valuations of the quality companies could become a drag on performance.
| GICS Sector | Current P/E | Historical Median P/E | Premium/Discount |
| Energy | 67.94 | 14.71 | 461.86% |
| Utilities | 19.28 | 15.36 | 125.50% |
| Consumer Staples | 23.00 | 19.66 | 116.99% |
| Financials | 15.84 | 14.62 | 108.34% |
| Materials | 19.57 | 18.40 | 106.36% |
| Health Care | 21.36 | 20.31 | 105.17% |
| Telecommunication Services | 17.05 | 17.60 | 96.90% |
| Consumer Discretionary | 19.80 | 20.56 | 96.30% |
| Industrials | 17.90 | 18.84 | 95.01% |
| Information Technology | 20.91 | 23.38 | 89.44% |
Where are the quality investments?
While US quality may be expensive, international stocks are more attractive. Excluding the US from the FTSE All World Developed Index (FTSE All World Developed xUS), we see that the valuations are more compelling, but the lower ROE (Return on Equity) and free cash flow yield show that the quality is still lacking.
| Russell 1000 | FTSE All-World Developed xUS | |
| Free Cash Flow Yield | 3.66 | 2.95 |
| ROE | 16.63 | 14.43 |
| Price/Earnings | 20.41 | 16.29 |
Free Cash Flow Yield: Measures a company’s total free cash flow relative to its enterprise value.
Free cash flow is the cash remaining after a company has paid expenses, interest, taxes, and long-term investments. It is the source from which dividends are paid.
FTSE All World Developed Large-Cap Index is a market-capitalization weighted index representing the performance of large-cap stocks in developed markets. Data calculated for the FTSE All World Developed Large-Cap Index screens out all US companies to represent a true international index.
Enterprise Value: A company’s market capitalization adjusted to eliminate any capital structure bias (i.e. by adding debt and subtracting cash or cash equivalents)
Given this information, we believe it may be wise for investors to consider a global mix of quality and value in these uncertain times.
The Pacer Global Cash Cows Dividend ETF (GCOW) tracks the Pacer Global Cash Cows Dividend Index and uses a global strategy that searches for quality and value by screening the FTSE Developed Large Cap Index for companies with high free cash flow yields and dividend yields. The stability of high dividend paying companies combined with high free cash flow yields to support the dividends has the potential to provide exposure to companies that can survive this turbulent economic climate. The Pacer Index offers exposure to companies with higher Free cash flow yields, higher ROE, and lower P/Es than its FTSE benchmark index. We believe the underlying characteristics of these companies should provide investors with exposure to both quality and value characteristics.
| Pacer Global Cash Cows Dividend Index | FTSE Developed Large-Cap | |
| Free Cash Flow Yield | 5.63 | 3.53 |
| ROE | 19.13 | 16.39 |
| Price/Earnings | 16.53 | 18.32 |
Learn more about how GCOW can help diversify your portfolio.
There is no guarantee dividends will be paid. A company’s ability to pay dividends may stop or be limited in the future.
The information presented here is not intended to forecast events or guarantee results. The strategies discussed are for educational purposes and are not a recommendation, offer or solicitation to buy or sell any securities or to adopt any investment strategy. There is no guarantee that any strategy will be effective.
This document does not take into account any investor’s particular investment objectives, strategies, tax status, or investment horizon. Please consult with your financial advisor and tax advisor before investing.
This document is not intended to be relied upon as a forecast, research or investment advice, and is not a recommendation, offer or solicitation to buy or sell any securities or to adopt any investment strategy. This document represents an assessment of the market environment at a specific time and is not intended to be a forecast of future events or a guarantee of future results. The user of this information assumes the entire risk of any use made of the information provided herein.
Download