

The PACER PERSPECTIVE
November 2023

Investing in the Intangible Economy:
Free Cash Flow as the Answer
- Danke Wang, CFA, FRM, Portfolio Manager
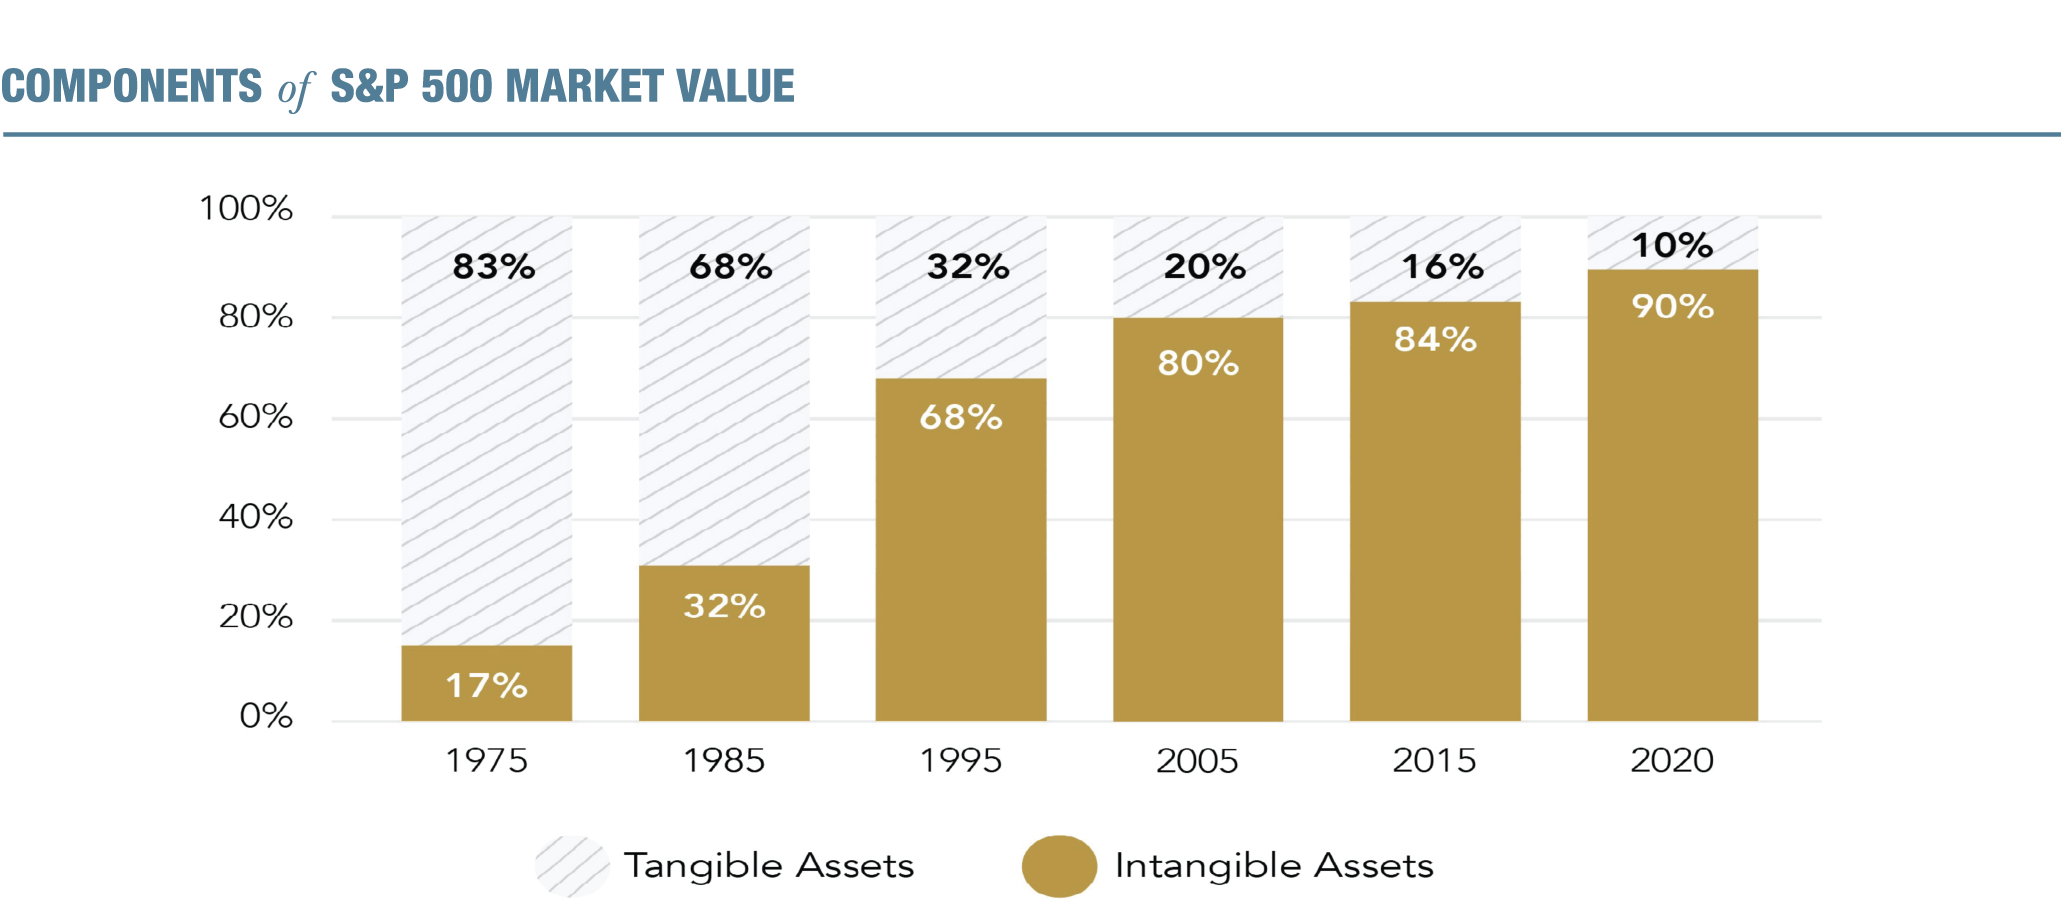
Over the last 20 years, a notable shift has occurred in the U.S. business landscape. More companies are adopting capital-light business models where their products or services are based on factors beyond traditional tangible assets like buildings and machinery.
Key takeaways:
- The growing significance of intangible assets and the ineffectiveness of financial reporting highlights investors’ need for a comprehensive approach to navigate the new investment landscape.
- There has been a strong correlation between companies’ investments in intangible assets and their free cash flow (FCF) generation.
- By focusing on FCF-related metrics, investors may gravitate towards more intangible-heavy companies in their value and growth portfolios.
Intangible assets have undergone a rapid ascension to become the primary drivers of business success and economic expansion. These assets, ranging from intellectual property, patents, brands, and software to human capital, reputation, and customer relationships, have assumed a central role in a company's capacity to generate and sustain profit margins. As these assets increasingly define a company's competitiveness and growth potential, investors are calling for a more comprehensive approach that can accurately capture and evaluate the economic value inherent in the intangible assets of these companies.
PAST PERFORMANCE IS NOT INDICATIVE OF FUTURE RESULTS. YOU CANNOT INVEST IN AN INDEX
Source: Ocean Tomo, LLC Intangible Asset Market Value Study, 7/1/2020: https://www.oceantomo.com/intangible-asset-market-value-study/
The Accounting Defect – Purchased Intangibles
On a company's balance sheet, intangible assets are typically recorded when they are acquired with an identifiable value and a specific lifespan. They are categorized as long-term assets and their value is based on the purchase price, with an associated amortization schedule. This accounting treatment means that intangible assets are only recognized when mergers and acquisitions (M&A) take place.
Following the acquisition, intangible assets are typically classified into two main categories: goodwill and other intangible assets.
Goodwill represents the excess cost of an acquisition over the fair value of the assets acquired. In simpler terms, it's the premium paid to the acquired company beyond the value of its total assets.
Other intangible assets represent the purchased assets associated with contractual rights, specific assets or liabilities, and other intangible elements. Nevertheless, proper valuation of intangible assets is still often problematic due to the difficulty in assigning value from their future benefits or in identifying their useful lives.

PAST PERFORMANCE IS NOT INDICATIVE OF FUTURE RESULTS. YOU CANNOT INVEST IN AN INDEX
Source: Pacer Advisors, FactSet
In essence, the intangible assets booked on a company’s balance sheet are only the intangibles assets which have been purchased. It's important to note these purchased intangible assets have gained significant prominence in recent years. In fact, since 2010, these intangible assets have accounted for more than 10% of the total assets within the Russell 1000 Index.
The Accounting Defect – internally generated intangibles
In the current economic landscape, internally generated intangible investments have taken on a pivotal role. Companies are actively engaged in the creation of intangible assets by investing in innovation projects, product development, advertising, and marketing.
R&D (research and development) and SG&A (Selling, General & Administrative) expenditures can be used to gauge those investments. For instance, R&D expenses include costs associated with the development of new ideas, design, and testing of new products or improvements to existing products. SG&A expenses, on the other hand, cover various costs, including marketing, sales, personnel, and other overhead expenses not directly related to goods sold.
While these expenditures can lead to the creation of valuable intellectual property or brand recognition, they are not capitalized unless acquired via M&A. Instead, these investments are treated as expenses on financial statements.
For example, when a company spends $100 million on a research project (R&D), an expense is recorded, reducing the earnings for the period and the company's book value. However, when the company purchases another company with an R&D investment worth $100 million, the value of the project is added to the acquirer’s book value.
The treatment of internally generated intangible investments as expenses can lead to an understatement of a company's true value and the significance of its intellectual capital. Given these inefficiencies in accounting rules, how can investors navigate the intangibles-driven economy, and effectively evaluate investment prospects in both value and growth stocks?
Two Observations – Intangibles & Free Cash Flow
In the past few decades, two significant trends have emerged in the U.S. economy. First, there has been a substantial increase in the proportion of intangible assets within companies’ overall value, as shown earlier. Second, there has been a notable increase in the amount of free cash flow (FCF) generated by U.S. corporations.

PAST PERFORMANCE IS NOT INDICATIVE OF FUTURE RESULTS. YOU CANNOT INVEST IN AN INDEX
Source: Empirical Research (1)Empirical Research U.S. Large Cap Stocks Universe
What's particularly intriguing is that free cash flow is frequently tied to intangible assets. Essentially, a company's ability to generate cash is increasingly dependent on its intangible assets, such as software, patents, branding, customer networks and supply chains.
The chart below demonstrates a compelling trend in the FCF generation among companies in the Russell 1000 Index, based on the proportion of their purchased intangible assets (balance sheet intangible assets) relative to total assets. It is apparent that companies with higher amounts of purchased intangible assets on their balance sheets tend to generate more FCF relative to their sales, exceeding companies with lower proportions of intangible assets. Furthermore, the chart's forward-looking perspective, spanning a 5-year timeframe, emphasizes the presence of intangible assets not only enhances short-term FCF, but also enables a company to sustain high FCF over the longer term.

PAST PERFORMANCE IS NOT INDICATIVE OF FUTURE RESULTS. YOU CANNOT INVEST IN AN INDEX
Source: Pacer Advisors, FactSet
Let’s take the analysis one step further. Based upon our earlier discussion, R&D and SG&A expenditures may reflect a company's investments in innovation, product development, and other intangible assets. We can use those expenses as a proxy for companies’ internal intangible asset creation by taking the 5-year average yearly R&D expenses and 30% of 5-year average SG&A expenditures as the share of 5-year average sales.2
It is interesting to note the top quintile of R&D and SG&A spenders in the Russell 1000 Index consistently generate significantly higher FCF (scaled by sales) over a 5-year period than all other companies in the universe. This observation underlines the strong correlation between companies' investments in intangible assets and improved financial outcomes, specifically in terms their FCF generation.
(2)Similar to method used by Peters and Taylor (2017) Peters, Ryan H., and Lucian A. Taylor. 2017. “Intangible Capital and the Investment-q Relation.” Journal of Financial Economics 123 (2): 251–72. https://www.sciencedirect.com/science/article/abs/pii/S0304405X16301969?via%3Dihub

PAST PERFORMANCE IS NOT INDICATIVE OF FUTURE RESULTS. YOU CANNOT INVEST IN AN INDEX
Source: Pacer Advisors, FactSet
Afterall, these trends highlight the evolving nature of business in the contemporary economy. As intangible assets become a more substantial component of a company's capital, their efficient management and development play a crucial role in driving profit and FCF, which in turn, is essential for sustaining growth, rewarding shareholders, and funding future endeavors.
The interaction between intangible assets and cash flow underscores the changing dynamics of corporate value creation.
Free Cash Flow as an Answer
Capital is an essential prerequisite for growth. When it comes to internal funding sources, free cash flow can be strategically allocated to endeavors such as research and development, advertising, and marketing, which are instrumental in driving business expansion and growth.

Drawing from the previous analysis, it becomes evident that by giving priority to FCF-related metrics in stock selection, investors may gravitate toward more intangibles-heavy companies.
This approach may lead to investments in businesses that are well-positioned to leverage the potential of intangible assets for long-term growth and value creation.
Our Solutions
The Pacer US Large Cap Cash Cows Growth Leaders ETF (COWG) invests in the highest FCF margin companies within the Russell 1000 Index.
As highlighted in our previous perspective “Growth Investing Illuminated: The “take-one” on FCF Margin”, FCF margin has emerged as a pivotal factor for identifying growth opportunities. Additionally, focusing on companies with high FCF margins may help growth investors to tap into the growth potential of companies with substantial intangible assets.
Below are some of the key holdings within the Pacer US Large Cap Cash Cows Growth Leaders Index (COWG Index) as of the end of September, along with their market capitalizations, weightings in the index, and their associated intangible assets:
COWG Index Holdings as of 9/30/2023
| Market Capitalization ($million) |
Weight in COWG Index (%) |
Intangible Assets | |
|---|---|---|---|
| Apple, Inc | 2,679,072 | 1.26 | Brand, Intellectual Property, Software and Operating Systems, App Ecosystem, Design and Innovation |
| Microsoft Corporation | 2,346,338 | 1.45 | Brand, Software, Intellectual Property, Cloud and AI Expertise, Customer Base, Ecosystem |
| Alphabet Inc Class A | 1,641,115 | 2.02 | Brand, Software, Intellectual Property, Data and Algorithms, Cloud Computing and AI Expertise, User Base |
| NVIDIA Corporation | 1,073,990 | 3.06 | Intellectual Property, Technology and Innovation, Software and Ecosystem, AI and Deep Learning Expertise |
| Broadcom Inc | 343,030 | 2.11 | Intellectual Property, Technology and Engineering Expertise, Brand, Licensing and Royalty Agreements |
| AbbVie Inc | 263,061 | 0.51 | Pharmaceutical Patents, Brand, Drug Pipelines, Clinical Data, Patient and Healthcare Professional Relationships |
| Coca-Cola Company | 242,058 | 0.57 | Brand, Trademarks, Beverage Formulas, Distribution Network, Marketing and Advertising Expertise |
| Adobe Incorporated | 232,514 | 2.47 | Software and Intellectual Property, Brand, Subscription-Based Services, Content Libraries, Data and Analytics |
| Cisco Systems, Inc | 218,588 | 1.04 | Intellectual Property, Brand, Software and Firmware, Customer Base, Data Analytics and Cybersecurity Expertise |
| Salesforce, Inc. | 197,711 | 1.49 | Software and Intellectual Property, Brand, Cloud Infrastructure, Customer Relationships, Data and Analytics |
For example, NVIDIA, a leading technology company specializing in graphics processing units (GPUs) and artificial intelligence, has a range of intangible assets that contribute to its success, including a substantial portfolio of patents, a strong brand associated with high-performance GPUs, expertise in AI and deep learning, and a comprehensive software ecosystem integral to its products' performance.
Coca-Cola, on the other hand, is known for having one of the most valuable and recognizable brands globally. The secret formulas for Coca-Cola's beverages, including Coca-Cola itself, are key to the company's product offerings. Its network, including bottling and distribution rights, is another intangible asset that ensures its products reach consumers efficiently.
The Pacer US Large Cap Cash Cows 100 ETF (COWZ) seeks to invest in the highest FCF yield (free cash flow / enterprise value) companies within the Russell 1000 Index. With enterprise value in the denominator of the FCF yield formula, investors may identify undervalued businesses that place a strong emphasis on intangible assets.
As discussed earlier, under the current accounting rules, metrics like book value and reported earnings tend to exhibit a bias in favor of tangible assets over intangible investments. Fixed asset investments are capitalized on the balance sheet, while book value and earnings are only decreased by depreciation over time.
Intangible related expenditures, on the other hand, are treated as expenses, resulting in a reduction of both book value and earnings. Free cash flow, to some degree, offers a relief from this bias. Both tangible and intangible investments are incorporated in the FCF calculation. As a result, FCF provides a more balanced and comprehensive perspective by considering all investments, whether they are tangible or intangible, thus mitigating the biases observed in other traditional financial metrics.
Accounting treatment’s impact on selected financial metrics
| Tangible (fixed) Investment | Intangible Investment | |
|---|---|---|
| Book Value | Increased, only decreased by depreciation | Decreased by expense |
| Earnings | No change, only decreased by depreciation | Decreased by expense |
| Free Cash Flow | Decreased by capital expenditure | Decreased by expense |
Because of these biases, popular valuation metrics like price-to-book (P/B) and price-to-earnings (P/E) ratios may misrepresent intangibles-heavy companies as overpriced.
For example, in late 2019, QUALCOMM's price-to-book ratio stood at over 20x, making it considerably more expensive than the S&P 500. However, the FCF yield painted a totally different picture. QUALCOMM's 6% FCF yield indicated that the stock was more attractive compared to the broader market, which offered a 3% yield.

PAST PERFORMANCE IS NOT INDICATIVE OF FUTURE RESULTS. YOU CANNOT INVEST IN AN INDEX
Sources: Pacer Advisors, FactSet, Bloomberg. Free cash flow yield is an internal statistic and doesn’t constitute investor yield.
Such misclassifications are particularly prevalent in sectors such as Technology, Healthcare and Consumer Discretionary, where intangible assets hold greater significance compared to sectors like Real Estate, Utilities, and Financials.

In summary, in today's evolving economic landscape, intangible assets are playing an increasingly important role. Investors are faced with the challenge of accurately capturing and evaluating the economic value inherent in intangible assets, not only in value stocks but also in growth stocks.
Investors can turn to free cash flow as a valuable financial metric. The interplay between intangible assets and FCF represents a contemporary approach to navigating the ever-changing investment landscape.
Free Cash Flow (FCF): A company’s cash flow from operations minus capital expenditures (expenses, interest, taxes, and long-term investments)
Free Cash Flow Margin: the FCF margin is a profitability ratio that compares a company's free cash flow to its revenue to understand the proportion of revenue that becomes free cash flow (FCF).
Free Cash Flow Yield: FCF/EV. Measures a company’s total free cash flow relative to its enterprise value. This is an internal statistic and does not constitute investor yield.
Book Value: Book value is the value of a company's total assets minus its total liabilities.
Earnings: A company's earnings are its after-tax net income.
Russell 1000 Index: is a market-capitalization weighted index representing the top 1000 large-cap stocks in the Russell 3000 Index.
Russell 1000 Value Index: is a market-capitalization weighted index representing approximately 1000 large- and mid cap value stocks in the Russell 3000 Index.
Capital expenditure: Capital expenditure is money a company uses to purchase, maintain, or expand fixed assets.
Depreciation: Depreciation refers to an accounting method used to allocate the cost of a tangible or physical asset over its useful life.
Price-to-Earnings ratio: the ratio measuring the stock price relative to its earnings per share (EPS).
Price-to-Book ratio: the ratio measuring the stock price against a company's book value.
This document is not intended to be relied upon as a forecast, research or investment advice, and is not a recommendation, offer or solicitation to buy or sell any securities or to adopt any investment strategy. This document represents an assessment of the market environment at a specific time and is not intended to be a forecast of future events or a guarantee of future results. The user of this information assumes the entire risk of any use made of the information provided herein.
Download