
The PACER PERSPECTIVE
September 2024

| Tweet |
Buffer ETFs:
An Alternative Solution to the 60/40 Allocation
- George Garcia, CFA, Portfolio Analyst
Investors often seek the traditional 60/40 balanced portfolio (60% equities/40% fixed income) for diversification and reduced volatility. However, with correlation between equities and fixed income rising in recent years, investors may want to consider an alternative approach to the traditional 60/40 balanced portfolio.
Key Takeaways
- The 60/40 portfolio has become less effective as equity and bond correlations have increased, reducing its diversification benefits.
- Buffer strategies, which use options to limit downside risk while allowing for some upside potential, offer a modern alternative to the 60/40 portfolio, especially in volatile markets
- Buffer strategies may provide more predictable outcomes, lower volatility, and potential tax advantages compared to traditional portfolios, particularly in non-tax-advantaged accounts.
Introduction
The traditional 60/40 balanced portfolio has long been the go-to strategy for investors seeking diversification and balancing risk and returns. The concept relies on equities for growth potential, while fixed income acts as a hedge during equity drawdowns. However, in recent years the correlation between equities and fixed income has increased, eroding the benefits of the traditional balanced portfolio.
One of the potentially effective ways to manage risk is through buffer strategies, which usually involves options contracts. These strategies provide a downside buffer up to a predetermined limit while still allowing for upside participation over a 1-year period, providing an approach with more predictability within investors’ portfolios.
Many investors have substantial exposure to the S&P 500, either through mutual funds or exchange-traded funds (ETFs). This exposure comes with inherent market risk, particularly during periods of heightened volatility. To manage this risk, investors can use buffer strategies to reduce the scale of potential losses during market downturns.
This paper will explore the mechanics of buffer strategies and their approach in managing risk in a portfolio exposed to the S&P 500. By reducing volatility, these strategies provide a structured approach and serve as a potential alternative to the 60/40 portfolio, balancing risk and reward in today’s market environment.
The Buffer Protection
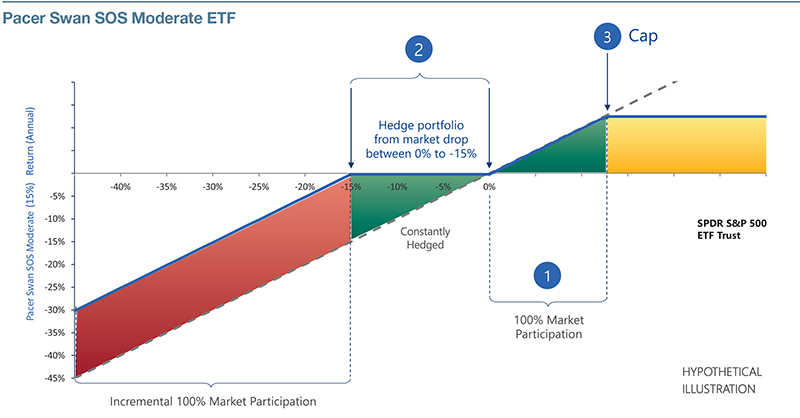
Buffer strategies typically aim to track the performance of a specific index such as the S&P 500 Index, and then safeguard investors from a predetermined portion of losses during market downturns. Buffer products provide a clear and predictable level of risk management, making them a valuable tool for preserving capital while still participating in market growth, albeit within the set limits.
For instance, with a buffer level ranging from 0% to 15%, the strategy absorbs the first 15% of loss on the downside. However, this comes at the cost of capping the potential upside, beyond a certain level. This is done through a combination of long and/or short put and call options.
PAST PERFORMANCE IS NOT INDICATIVE OF FUTURE RESULTS. YOU CANNOT INVEST IN AN INDEX
Source: Pacer Advisors This is a hypothetical illustration and does not demonstrate historical or future performance data. It does not include fees or expenses. The structured outcomes may only be realized if you are holding shares on the first day of an Investment Period and continue to hold them on the last day of that Investment Period. If you purchase shares after an Investment Period has begun or sell shares prior to an Investment Period’s conclusion, you may experience investment returns very different from those that the Fund seeks to provide. There is no guarantee that the Fund will achieve its investment objective. The Funds have characteristics unlike many other traditional investment products and may not be suitable for all investors. For more information regarding whether an investment in the Fund is right for you, please see “Investor Suitability” in the prospectus.
The Investment Case: An Alternative to the 60/40 Balanced Portfolio
Investors traditionally turn to fixed income as a counterbalance to equities, aiming for stability amid market volatility. However, since early 2022, the correlation between equities and fixed income has been unusually high, diminishing their usual diversification benefits. This reduced diversification hampered balanced portfolio performance, with the S&P 500 Total Return Index declining by 18.11% and the Bloomberg U.S. Aggregate Total Return Index down by 13.01% for the year. These results underscore the challenges in achieving risk reduction and stable returns through traditional diversification strategies.

PAST PERFORMANCE IS NOT INDICATIVE OF FUTURE RESULTS. YOU CANNOT INVEST IN AN INDEX
Source: Bloomberg, Pacer Advisors
Buffer strategies attract investors with their combination of downside risk mitigation and upside participation. This strategy is particularly appealing to investors who prioritize capital preservation over maximizing returns.
By using the Cboe S&P 500 15% Buffer Protect Index July Series as the proxy for the buffer strategy, which protects investors from the first 15% of losses on the downside, we can observe the differences in performance, volatility, and drawdown buffer strategies can achieve compared to a 60/40 portfolio (composed of the S&P 500 Index and the U.S. Aggregate Bond Index or “AGG Index”) over the period from 12/29/2006 – 9/30/2024.
Performance Characteristics
12/29/2006 - 9/30/2024
| Cboe S&P 500 15% Buffer Product Index July Series | 60% S&P 500 Index/40% Bloomberg AGG Index | S&P 500 Index | |
| Returns (Annualized) | 7.06% | 7.85% | 10.36% |
| Volatility | 11.26% | 11.50% | 20.01% |
| Max Drawdown | -34.81% | -35.10% | -55.25% |
PAST PERFORMANCE IS NOT INDICATIVE OF FUTURE RESULTS. YOU CANNOT INVEST IN AN INDEX
Source: Pacer Advisors, Bloomberg
These results show that the Cboe S&P 500 15% Buffer Protect Index July Series performs similarly to a 60/40 portfolio, offering comparable volatility and maximum drawdown. However, over the last three years, as equity and fixed income correlation increased, the Cboe S&P 500 15% Buffer Protect Index July Series has significantly outperformed the traditional balanced portfolio while maintaining lower levels of volatility and maximum drawdown.
Performance Characteristics
9/30/2021 - 9/30/2024
| Cboe S&P 500 15% Buffer Product Index July Series | 60% S&P 500 Index/40% Bloomberg AGG Index | S&P 500 Index | |
| Returns (Annualized) | 12.34% | 6.66% | 11.90% |
| Volatility | 8.98% | 11.39% | 17.59% |
| Max Drawdown | -8.34% | -20.83% | -24.49% |
PAST PERFORMANCE IS NOT INDICATIVE OF FUTURE RESULTS. YOU CANNOT INVEST IN AN INDEX
Source: Pacer Advisors, Bloomberg
This suggests the buffer protection strategy effectively mitigates downside risk while still providing solid returns, making it possibly a more attractive option for investors seeking a balance between growth and risk management.
When examining the yearly returns and volatility, the Cboe S&P 500 15% Buffer Protect Index July Series demonstrates its ability to mitigate negative performance, particularly in challenging years like 2018, where it avoided the losses seen in a balanced portfolio. Another notable year is 2022, when the buffer protection was fully utilized. The balanced portfolio suffered a significant negative return of -15.91%, while the Cboe S&P 500 15% Buffer Protect Index July Series limited its loss to just -1.37%. This highlights the effectiveness of the buffer in safeguarding against steep declines, providing a possible advantage during market downturns
Calendar Year Returns and Volatility
12/31/2006 - 9/30/2024
| Calendar Year Returns | Calendar Year Volatility | ||||
| Year Returns | Cboe S&P 500 15% Buffer Protect Index July Series | 60% S&P 500 Index40% Bloomberg Aggregate Bond Index | Cboe S&P 500 15% Buffer Protect Index July Series | 60% S&P 500 Index40% Bloomberg Aggregate Bond Index | |
| 2007 | 7.06% | 6.19% | 12.18% | 9.10% | |
| 2008 | -17.43% | -21.63% | 25.23% | 22.21% | |
| 2009 | 16.09% | 18.46% | 19.87% | 15.71% | |
| 2010 | 13.34% | 12.19% | 8.41% | 10.25% | |
| 2011 | 2.57% | 4.98% | 13.05% | 12.93% | |
| 2012 | 8.84% | 11.37% | 6.98% | 7.10% | |
| 2013 | 12.51% | 17.73% | 3.64% | 6.82% | |
| 2014 | 3.99% | 10.56% | 3.73% | 6.46% | |
| 2015 | 3.47% | 1.20% | 6.77% | 8.94% | |
| 2016 | 5.08% | 8.21% | 6.27% | 7.48% | |
| 2017 | 8.37% | 14.26% | 1.97% | 3.82% | |
| 2018 | 0.07% | -2.26% | 7.11% | 9.91% | |
| 2019 | 16.48% | 22.11% | 7.09% | 6.99% | |
| 2020 | 9.42% | 15.37% | 17.50% | 19.41% | |
| 2021 | 7.83% | 15.96% | 4.61% | 8.03% | |
| 2022 | -1.37% | -15.91% | 10.62% | 15.61% | |
| 2023 | 21.62% | 17.71% | 9.23% | 8.76% | |
| 9/30/2024 | 13.71% | 14.99% | 6.96% | 8.22% | |
PAST PERFORMANCE IS NOT INDICATIVE OF FUTURE RESULTS. YOU CANNOT INVEST IN AN INDEX
Source: Pacer Advisors, Bloomberg
Additional: Concern for Non-Tax Advantage Investors
For investors with a balanced portfolio in a non-tax-advantaged account, receiving dividends and coupon payments may be a tax concern. Qualified dividends are taxed at 0%, 15%, or 20%, while nonqualified dividends and bond fund income are taxed as ordinary income. This could adversely affect taxes and portfolio performance if the current distribution of income is not needed for an investor.
To simplify, let’s assume an investor has a $100,000 investment in a traditional balanced portfolio (non-tax advantaged portfolio) split between 60% SPY and 40% AGG at the start of 2023, along with a taxable income of $100,000 for 2023. This investor would face tax liabilities.
Based on actual distribution for 2023, in the SPY allocation the investor would earn approximately $1,045.19 in dividend payments. Even if all dividends were qualified, the tax rate would be 15%, resulting in a tax bill of $156.78. For the AGG allocation, the investor would receive approximately $1,274.12 in total income payments, which would be taxed at a 24% rate, leading to a tax bill of $305.79. This investor would be hypothetically responsible for $462.57 in the form of a tax bill for the year 2023, eroding the returns of the portfolio by .46%.
2023 Tax Rates for a Single Taxpayer
| Tax Rate | On taxable income from... | Up to... |
| 24% | $95,376 | $182,100 |
Source: Internal Revenue Service
2023 Tax Rates for a Single Taxpayer on Long Term Capital Gains and Qualified Dividends
| Tax Rate | On taxable income from... | Up to... |
| 15% | $44,626 | $492,300 |
Source: Internal Revenue Service
On the other hand, if an investor had invested in the Pacer Swan SOS Moderate July ETF (PSMJ) at the start of 2023 and held it throughout the entire year, they would have gained exposure to the S&P 500, equivalent to the Cboe S&P 500 15% Buffer Protect Index July Series. However, due to the buffer strategies unique option contract structure related to dividends, PSMJ did not pay any dividends in 2023, meaning the investor would not have incurred any tax liability for dividends during that 2023 year.
Conclusion
In conclusion, the traditional 60/40 balanced portfolio has seen its effectiveness diminish as the correlation between equities and fixed income has increased. Buffer strategies offer a modern alternative for a more defined outcome. Buffer strategies, particularly relevant in volatile markets, may offer more predictable outcomes compared to the 60/40 portfolio approach.
The performance comparison between the Cboe S&P 500 15% Buffer Protect Index and the 60/40 portfolio demonstrates the advantages of buffer strategies. From 2018 to 2024, the buffer strategy exhibited lower volatility, smaller drawdowns, and better overall performance, particularly during market downturns.
Additionally, the tax implications of traditional balanced portfolios can further diminish returns, especially in non-taxadvantaged accounts where both dividend and income payments may be subject to taxation. In contrast, buffer products, like PSMJ (the ETF equivalent of the Cboe S&P 500 15% Buffer Protect Index), do not pay dividends, possibly reducing tax liabilities and enhancing after-tax returns.
The complete Pacer SWAN SOS ETF series includes 13 funds tailored to various risk preferences: moderate, conservative, flex, and a fund of funds. The moderate ETFs provide a buffer of 0% to 15%, while the conservative ETFs offer protection from -5% to -30%. Flex ETFs provide a buffer of 0% to 20%, then decline by 2% for every 1% drop in the SPDR S&P 500 ETF Trust, up to -40%; beyond that, they match the market, dropping 1% for each 1% loss in the SPDR S&P 500 ETF Trust. The series also includes PSFF, an actively managed fund of funds. Each of these investments varies in cap, allowing investors to choose the product that best meets their goals.
Overall, buffer strategies present a strong alternative to the 60/40 portfolio by delivering defined downside protection, more consistent returns, and potential tax benefits.
SPDR S&P 500 ETF Trust (SPY) is an exchange-traded fund that seeks to mirror the performance of the S&P 500 Index, which represents 500 of the largest publicly traded companies in the United States.
iShares Core U.S. Aggregate Bond ETF (AGG) is an exchange-traded fund that tracks the Bloomberg U.S. Aggregate Bond Index. It provides broad exposure to U.S. investment-grade bonds, including Treasuries, mortgage backed securities, and corporate bonds.
Annualized returns are the average returns an investment earns per year over a specific period, adjusted to show what the yearly return would be if it were steady each year.
Volatility measures how much an asset's price fluctuates over time, indicating the level of risk or uncertainty in its value. High volatility means large price swings, while low volatility suggests more stable prices.
Max drawdown is the largest decline in an investment's value from its peak to its lowest point over a specific period. It measures the potential downside risk by showing how much an asset could lose before recovering.
S&P 500 Total Return Index: The S&P 500® Index is a popular gauge of large-cap U.S. equities and includes 500 leading companies, capturing approximately 80% coverage of available market capitalization.
Cboe S&P 500 15% Buffer Protect Index: SPBFA is designed to track the performance of a long exposure to the S&P 500 Index (“SPX Index”) and a long S&P 500 Option (“SPX Option”) put spread vs. short call expiring annually on the last business day of December. The Index aims to provide protection against up to a 15% decline in the S&P 500 Index while providing participation up to a capped level.
Bloomberg AGG Index: The Bloomberg US Agg Index is a broadbased flagship benchmark that measures the investment grade, US dollar-denominated, fixed-rate taxable bond market. The index includes Treasuries, government-related and corporate securities, MBS (agency fixed-rate pass-throughs), ABS and CMBS (agency and non-agency).
Option Contract: An option contract is a derivative financial instrument that grants the holder the right, but not the obligation, to buy or sell an underlying asset at a predetermined strike price within a specific time frame.
Call Option: A call option is a type of option contract that gives the buyer the right, but not the obligation, to purchase the underlying asset at a set strike price before or on the contract's expiration date.
Put Option: A put option is a type of option contract that grants the buyer the right, but not the obligation, to sell the underlying asset at a predetermined strike price before or on the contract's expiration date.
Pacer Financial and its affiliates do not provide tax, legal or accounting advice. This material has been prepared for informational purposes only, and is not intended to provide, and should not be relied on for, tax, legal or accounting advice. Investors should consult with their own tax, legal and accounting advisors before engaging in any transaction.
Each single Buffer Fund will invest substantially all of its assets in FLexible EXchange® Options (“FLEX Options”) that reference the SPDR® S&P 500®ETF Trust (the “Underlying ETF”). FLEX Options are customizable exchange-traded option contracts guaranteed for settlement by the OptionsClearing Corporation. The Fund uses FLEX Options to employ a “structured outcome strategy.” Structured outcome strategies seek to produce predetermined target investment outcomes based upon the performance of an underlying security or index. The pre-determined structured outcomes sought by the Funds, which include the buffer and cap discussed below, are based upon the performance of the Underlying ETF over a one year period. Fund shareholders are subject to an upside return cap that represents the maximum percentage return an investor can achieve from an investment in a Fund for an Investment Period. Therefore, even though the Funds’ returns are based upon the Underlying ETF, if the Underlying ETF experiences returns for an Investment Period in excess of the Cap, an investor will not experience those excess gains. The Cap is set on the first day of a Funds’ Investment Period and does not take into account any management fees, transaction costs or expenses charged to shareholders. The Cap will be reduced by these when taken into account. Each single Buffer Fund only seeks to provide shareholders that hold shares for an entire Investment Period with a buffer against a pre-determined percentage of Underlying ETF losses (based upon the value of the Underlying ETF at the time the Fund entered into the FLEX Options on the first day of its Investment Period) during an Investment Period. You will bear all Underlying ETF losses beyond that pre-determined percentage. The buffer is provided prior to taking into account annual Fund management fees, operating expenses, transaction fees, and any extraordinary expenses incurred by a Fund. A shareholder that purchases shares at the beginning of an Investment Period may lose their entire investment. While each Fund seeks to limit losses for shareholders who hold shares for the entire Investment Period, there is no guarantee it will successfully do so.
Swan Global Management, LLC serves as investment sub-adviser to the Fund. Swan Global Investments, LLC (“Swan”) is an independent Investment Advisory headquartered in Durango, Colorado registered with the U.S. Securities and Exchange Commission under the Investment Advisers Act or 1940. Being an SEC-registered advisor implies no special qualification or training. Swan offers and manages its Defined Risk Strategy, as well as, option-based overlay strategies to individuals, institutions and other advisory firms.
Download